POWERSCOUT®

POWERSCOUT® Widgets -Configuration options

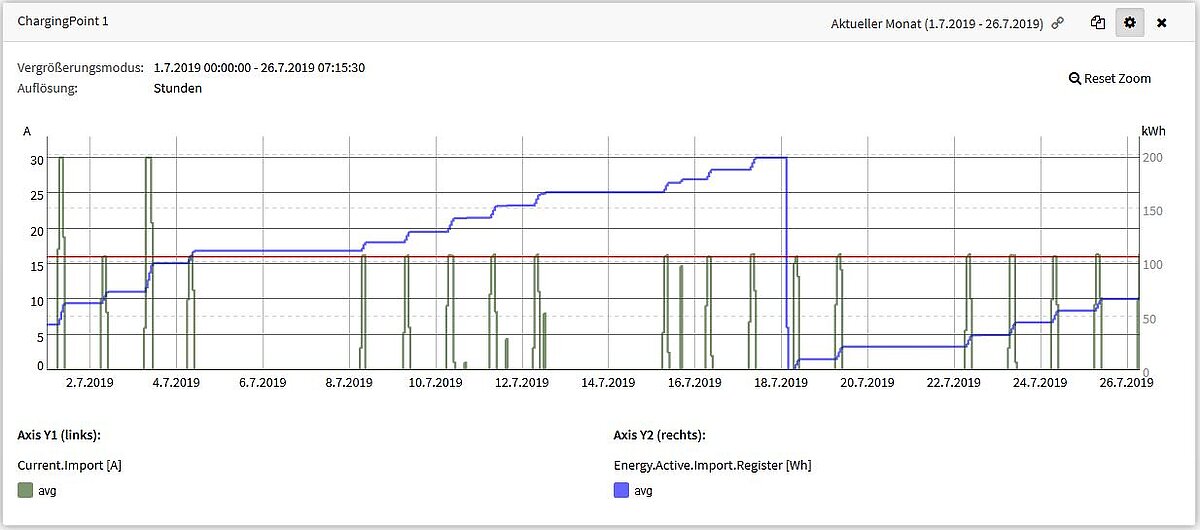
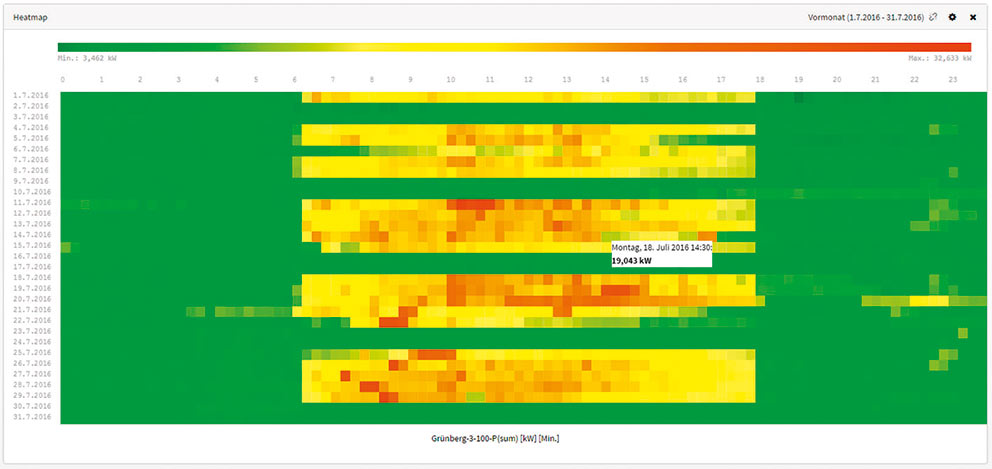
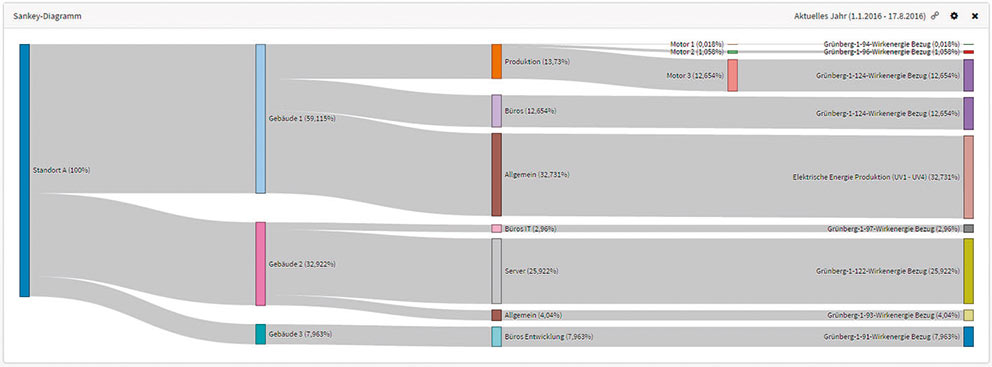
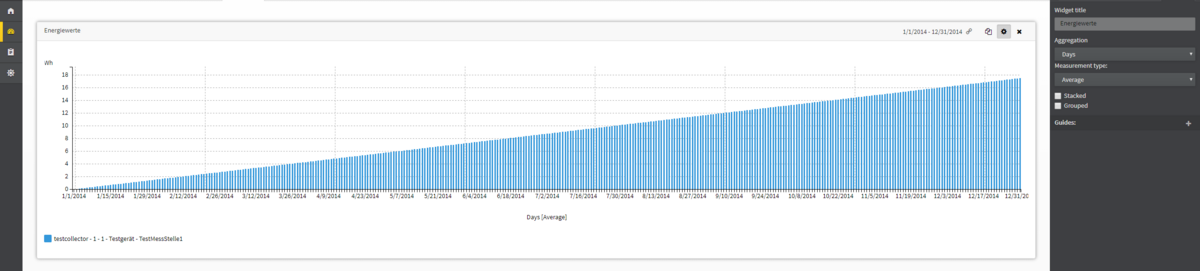
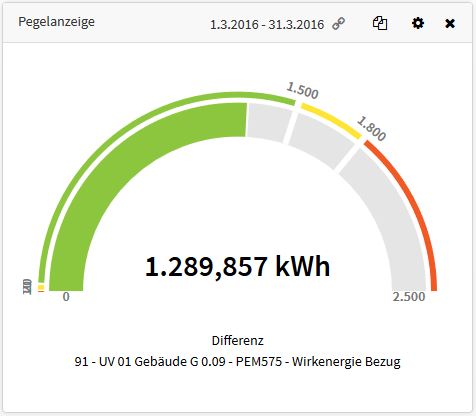
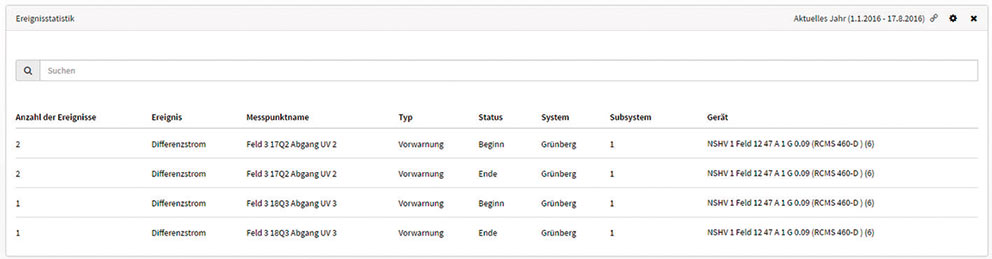
Widgets are graphical components that allow individual adjustment of the content displayed in POWERSCOUT®. The widgets can be displayed in individual sizes and positions on a dashboard.

A dashboard can show a time period. The widgets displayed on the dashboard can differ from the set dashboard time and show individual time periods.

Graph

  • Linear and logarithmic representation
    • Insulation values can be displayed more clearly
  • Scrolling and zooming with the mouse wheel is possible
  • Display of events
  • Minimum and maximum of the Y axis adjustable
  • Two Y axes
  • Line colour selection
  • Adjustable line width
  • Guides can be displayed

Heat map

  • Représentation des valeurs particulièrement marquantes d'une manière facilement reconnaissable
  • Inversion des couleurs afin de permettre de représenter également les défauts d'isolement
  • Valeurs limites réglables

Sankey diagram

  • Graphic representation of quantity flows
  • Preferably used for energy monitoring
  • System view freely configurable

Bar graph

  • Display of cumulative meter values in a bar graph
  • Grouping of data in ascending order
  • Aggregation by days, weeks, months, quarters and years
  • Guides can be displayed

Gauge

  • Lower and upper limit values flexibly adjustable
  • Monitoring of measured values

Alarm state

  • Display of alarm states
  • Fault detection at a glance
  • Monitoring of the service state of your system
  • Easy detection of residual currents across system parts

Measurement statistics

  • Display of a measured value as statistics
  • Minimum, maximum and average values can be displayed
  • Colour differentiation individually adjustable
  • Guides can be displayed

Table view

  • Display of measured values in a table
  • Minimum, maximum and average values can be displayed
  • Complete overview of minimum, maximum and average values of several measured values

Event statistics

  • Documentation of events
  • State display of channels
  • Start and end of events
  • Tabular view
  • Targeted search for events

Event protocol

  • Documentation of events
  • State display of channels
  • Start and end of events
  • Tabular view
  • Targeted search for events

Text editor

  • Description of dashboards
  • Adding custom images

Links

Press release: Find out today what won't happen tomorrow

Downloads

NameCategorySizeLanguageTimestampD-/B-Number
POWERSCOUT® Datasheets 987.4 KB EN2021/05/2828.05.2021D00235
POWERSCOUT® Hosted (from COMTRAXX version 4.00) Quickstarts 918.3 KB EN2020/02/2828.02.2020D00420
Release Note POWERSCOUT® Product Change Notification 278.0 KB EN2021/03/1818.03.2021
POWERSCOUT® Product Brochures 3.1 MB EN2023/12/1919.12.2023
POWERSCOUT® Hosted (up to COMTRAXX version 4.00) Quickstarts 751.6 KB EN2020/02/2828.02.2020D00317

Products

Communication

Powerscout
POWERSCOUT®

Recognising connections – optimising maintenance

COMTRAXX® COM465IP

Condition Monitor with an integrated gateway for the connection of Bender devices to Ethernet-TCP/IP networks

COMTRAXX® COM465DP

Condition Monitor with an integrated gateway for the connection of Bender devices to PROFIBUS DP and Ethernet-TCP/IP networks

Operator Control Panels

COMTRAXX® CP9xx
COMTRAXX® CP9xx series

Control Panel - signalling and operating panel for medical and other areas

Communication

Powerscout
POWERSCOUT®

Recognising connections – optimising maintenance

Details
COMTRAXX® COM465IP

Condition Monitor with an integrated gateway for the connection of Bender devices to Ethernet-TCP/IP networks

Details
COMTRAXX® COM465DP

Condition Monitor with an integrated gateway for the connection of Bender devices to PROFIBUS DP and Ethernet-TCP/IP networks

Details

Operator Control Panels

COMTRAXX® CP9xx
COMTRAXX® CP9xx series

Control Panel - signalling and operating panel for medical and other areas

Details
qhy4raey

Do you have any questions?

Please contact us! We are here to help.

To contact form